Showing posts with label ANALYTICS. Show all posts

Saturday, April 9, 2022

Part 1: Blockchain Analytics is More of an Art Than Science

By Heidi Wilder, Senior Associate, Coinbase Special Investigations Team

Intro

Bitcoin and many other cryptocurrencies are often referred to as pseudonymous. Everyone can view records on a public ledger, but not necessarily know who’s behind each address or transaction. But what does pseudonymity look like in practice? How are cryptocurrencies tracked? And can you really unmask someone on the blockchain? Let’s find out.

The public nature of blockchains allows for a certain degree of predictive analysis, enabling researchers to associate addresses and transactions with entities and sometimes individuals. Anybody can look at blockchain, but what makes a difference is the accurate interpretation of this public data, as well as corroborating it with other types of information gathered externally. Once combined such data can be used for blockchain analytics.

Blockchain analytics is widely used for market intelligence, trend analysis, and investigations, among many emerging spaces. The main objective of blockchain analytics is attribution — linking specific assets and events to particular entities or even individuals.

Attributing ownership, however, is often nuanced because outside observers can only infer it depending on factors such as availability and quality of the evidence. Evidence means proof that indeed an address belongs to an individual or entity. Unless you own an address yourself, it is very difficult to say with absolute certainty who an address is owned by. This is why it’s more fitting to consider blockchain analytics more of an art than science.

Let’s understand the basics of blockchain analytics and learn why attribution is often more complicated than it looks.

Attribution Basics

Can you tell what entity this address belongs to:

1JxXMEbYX6juuEK7QPe6CxGXywQ91ZB5mZ?

Is it an exchange? Is it a darknet market? Or maybe a private (otherwise known as an unhosted) wallet? To answer this question we need to dig for some ground truth.

1. Ground Truth Evidence

A search for truth often starts with plain googling or crowd-sourced sites like BitcoinAbuse.com:

Websites like BitcoinAbuse.com can be used by anyone to anonymously report BTC addresses linked to suspicious activity. Sadly, the reliability of such information can be very low. According to Blockchain.com, our address of interest received over 767 BTC. WalletExplorer.com implies this address is linked to a large offshore cryptocurrency exchange, which is corroborated by commercial blockchain analytics tools.

Indeed, commercial blockchain analytics tools identify this address as belonging to a large offshore cryptocurrency exchange.

So what about the nature of the activity? Is the exchange user involved in ransomware?

Further research connects this address to an exchanger called Coinguru.pw:

Coinguru allows users to swap between various cryptocurrencies, providing nothing more than an email address.

At this point you’re probably asking yourself: so who does this address belong to?

  • the BitcoinAbuse crowd-reported ransomware operator?
  • A large offshore cryptocurrency exchange?
  • Coinguru?
  • …all of the above?!

Well, the answer is complicated.

We have first-hand evidence of 1JxXMEbYX6juuEK7QPe6CxGXywQ91ZB5mZ being used by Coinguru, an exchange service operating an account on a large offshore cryptocurrency exchange. Exchangers like Coinguru often use bigger platforms’ infrastructure to reduce costs and get access to liquidity. We refer to these as nested services. These also cater to users who might not want to go to the trouble of creating their own accounts on an exchange. In fact, some nefarious actors may use these services to cash out of illicit funds.

For labeling purposes, it would suffice to say this is an exchange-owned address. If a regulator or a law enforcement agency investigating ransomware related transactions decides to enquire about the details, the cryptocurrency exchange will refer them to Coinguru who would be best positioned to provide further information on specific transactions.

2. Evidence quality and standard of proof

Evidence can vary in quality and blockchain analytics is no exception. Sometimes you might stumble upon a “smoking gun”, but it’s more likely you will need to spend time corroborating incomplete, circumstantial, fragmented or straight out misleading evidence. Nevertheless, even the weakest evidence can hint on a particular activity or entity behind it.

As we’ve already witnessed, crowd-reported sources such as BitcoinAbuse stand on the bottom of the reliability ladder. Not that they should be fully discounted, but evidence leading to attribution of crypto addresses is best gathered directly from the source. In the case of exchange services, the source would be their website displaying a deposit address.

The ultimate attribution comes from the ability to interact with the service, earning such evidence the highest confidence score. However, this is often prohibited, especially when investigating activities such as terror funding (TF). In cases like these, research shifts into the world of open source intelligence (OSINT). Much can be learned from aggregator websites, online forums, chat groups, mobile communication platforms, hidden domains on the Tor network and information scraping in an automated fashion by third party vendors. But even the best evidence is not helpful without proper investigative tools.

3. Deconflicting misattribution

Blockchain investigation tools include blockchain analytics software, private and open source databases, search engines, etc. The best investigative practice is to combine a mix of these tools, including commercially available software, and corroborate evidence using independent sources. Sometimes, however, those sources can offer conflicting information.

For instance, consider this address: 1N9SxKeNvFoBFuFKEDU8yFCwPwoeHqgmhu.

Imagine an investigator receiving intelligence linking this address to the sale of Child Sexual Abuse Material (CSAM). Attribution of this address will vary depending on which blockchain analytics tool you consult: some don’t have it labeled at all, while others attribute it to a merchant service. Open source research confirms this particular service allowed users to upload files and sell them for various cryptocurrencies. Addresses like the one above were generated for every user and were all connected to different types of activity, depending on what an individual user was buying.

While some uploads to this merchant service have been benign, some were identified as illicit, according to the Internet Watch Foundation (IWF), a non-profit combating the distribution of CSAM. Reportedly, the same merchant service was also used for ransomware decryptor key uploads. So, can the address of interest belong both to an illicit vendor and to the merchant service? Yes.

The correct way to attribute this service in a blockchain analytics tool would be to take all of the known addresses associated with the service and label them accordingly. Then, as a result of investigating individual addresses and their related activities, specific labels should be applied in accordance with documented findings. Labeling the whole service as illicit would be a misattribution. It can negatively impact tools and services that rely on blockchain analytics data, such as transaction monitoring systems or law enforcement subpoenas, leading to increased false positive alerts and erroneous leads.

4. The unknown unknowns

Back in October 2019, a medium article was published with a flashy title — “Huge Ethereum Mixer”. A Russian data scientist analyzed ETH flows between February and September 2017 claiming that “…68% of total Ethereum transaction value [is] controlled by one system… Funds come and leave within one hour, and addresses are never used again.” The researcher spent a great deal of effort analyzing the behavior of the “mixer”, its transaction patterns, and share of total transactions across Ethereum over time. At the center of the article was this diagram:

Notice how most large exchanges at the time are present: Kraken, Poloniex, Bitfinex, etc. Can you guess which one(s) are missing?

Hopefully, at this point it’s fairly evident that an external observer cannot possibly gain a full picture or claim 100% confidence in attribution. Keep in mind, when it comes to blockchain, everyone is an external observer, with the exception of addresses you control.

Stay tuned for the second part, where we’ll dive deeper into examples of how blockchain analytics can both enlighten and confuse.


Read More https://bitcofun.com/part-1-blockchain-analytics-is-more-of-an-art-than-science/?feed_id=14639&_unique_id=625198fc9f641

Thursday, March 31, 2022

Part 2: Blockchain Analytics is Tricky at Scale

By Coinbase Special Investigations Team

In our last post we walked through the basics of blockchain analytics and attribution. In this follow-up post, we will demonstrate how powerful blockchain analytics is and how tricky it can get at scale. We’ll start with reviewing some of the common blockchain analytics scaling methods used in fortifying Compliance programs as well as bolstering sanctions controls.

1. Commonspend

Blockchain analytics software relies on detecting patterns of certain address activities, known as heuristics. The primary heuristic applied to all UTXO blockchains (Unspent Transaction Output, like Bitcoin, Litecoin and their forks) is the commonspend heuristic.

It works as follows: take the following address 1P354Tw8VaSteYph84ext3f4fAYnSJQGuZ, as seen in this Youtube video involving a deposit to LocalBitcoins. So, we know this address belongs to LocalBitcoins and is an individual’s deposit address.

In this transaction we see that our LocalBitcoins address appears as one of the inputs:

Since we know that 1P354Tw8VaSteYph84ext3f4fAYnSJQGuZ belongs to LocalBitcoins and because we know that in order for this address and others to be spending funds together in the same transaction hash (i.e. inputs), the sender must have all of the private keys to each input address. We therefore can reason that all input addresses in this transaction belong to LocalBitcoins. Thus all input addresses belonging to Local Bitcoins can be clustered together.

Some block explorers automatically apply the commonspend heuristic to their analysis. For example, if you take a look at our original address in CryptoID or WalletExplorer, you’ll see that it belongs to a cluster of 990k+ addresses.

This heuristic remains a cornerstone of blockchain analytics. In fact, the most popular blockchain analytics tools already apply the commonspend heuristic to all Bitcoin addresses before they even know what the attributions for the addresses are.

But heuristics, even as straightforward as commonspend, can’t always be trusted.

2. Commonspend isn’t always common

So when does the common spend heuristic not apply? Consider this transaction:

The above transaction has multiple inputs and also multiple outputs. This is a more complex type of a transaction, referred to as coinjoin. Several users who don’t necessarily know each other might decide to participate together in a coinjoin transaction, pooling all their funds together. This is often done through dedicated privacy software such as Samourai or Wasabi wallets.

Coinjoin above leads to obfuscation of funds through seemingly random output addresses. It also renders any commonspend-based analysis ineffective, even though each party that participated in the coinjoin still gets out the same amount of Bitcoin that they originally put in (minus the fee paid to the service). Demixing such transactions is difficult (but not always impossible), and it is just one example of defeating commonspend.

3. Bringing it all together

Now that we’ve learned about ground truth, evidence quality, deconflictions, misattributions, and what commonspend is, let’s walk through how it comes together in identifying addresses belonging to illicit entities, like those 25k we discussed in our previous blog post.

The Office of Foreign Assets Control (OFAC) — a regulatory agency in the US responsible for sanctions enforcement — published a notice designating about 100 addresses, as well as entities they belong to. So, how did we go from under a hundred to over 25 thousand addresses?

3E7YbpXuhh3CWFks1jmvWoV8y5DvsfzE6 was one of the addresses designated by OFAC as belonging to Chatex — Russian Telegram bot that allows users to exchange crypto:

An official government website is a pretty reliable source of information, giving us confidence in the evidence quality. Now we need to assess each address to identify whether it’s a part of a larger group of addresses (e.g. a cluster) controlled by an entity. Using commonspend heuristic, we can associate 3E7YbpX…vsfzE6 address with a group of over 25k addresses. You too can verify this using a public block explorer, such as CryptoID:

After some additional checks we confirmed that all of these addresses belong to Chatex. And since the entity was sanctioned by OFAC, we are required to block respective transactions. It is worth noting that our list of blocked addresses is significantly larger. It includes other sanctioned entities as well as designated individuals. We also engage in proactive work to identify sanctioned activity originating from various jurisdictions, including Russia. But that’s a subject for another blogspot…


Read More https://bitcofun.com/part-2-blockchain-analytics-is-tricky-at-scale/?feed_id=13319&_unique_id=6245612758aba

Friday, March 4, 2022

Footprint Analytics: Stellar aims for rebound in 2022

Analysis

Last month, the Stellar Development Foundation (SDF) participated in a cryptocurrency hearing hosted by the U.S. House Committee on Financial Services.

 Footprint Analytics: Stellar aims for rebound in 2022

 Symbiosis

Last month, the Stellar Development Foundation (SDF) participated in a cryptocurrency hearing hosted by the U.S. House Committee on Financial Services.

CEO Denelle Dixon presented the technology of the Stellar decentralized payment system and its applications. With the recent news that Ukraine and Mexico will be using Stellar to run their digital currencies, Stellar is once again in the spotlight.

What is Stellar

Launched in 2014, Stellar is a platform that supports cross-border transactions between currency pairs and aims to solve global payments problems through blockchain technology.

The global payments and settlement system are complicated with various fiat currencies and each country’s financial and regulatory systems.

Stellar aims to solve this problem by making transfers between different currencies efficient (within 5 seconds) and low cost (under 1 cent USD) through decentralized transaction validation.

The current status of Stellar

In its seven years of development, Stellar used to have an illustrious history.

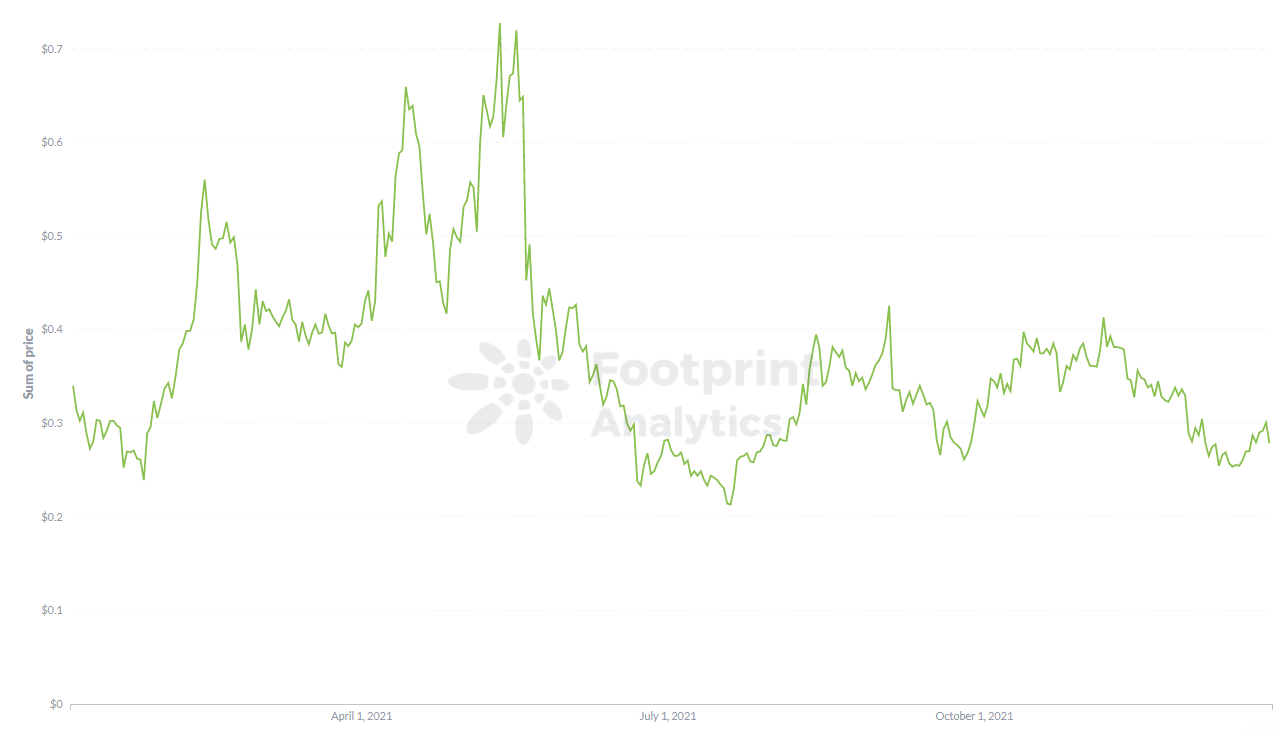
It was once a top 10 blockchain project in terms of Market Cap. And even set a record for a 100x increase in token price before DeFi Summer.

Unlike projects in the crypto world, Stellar has built many partnerships with the traditional financial community, including IBM and national financial institutions.

 Footprint Analytics - XLM Price
Footprint Analytics – XLM Price

However, according to Footprint Analytics, Stellar is currently growing slowly.

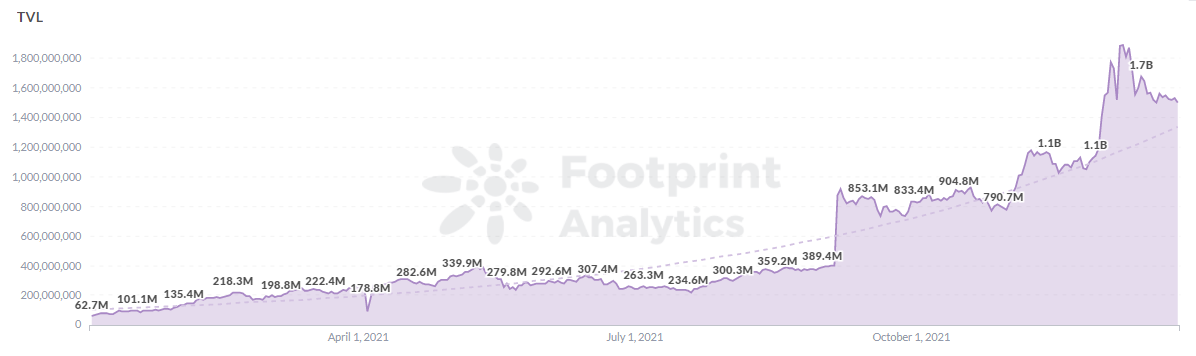
After years of growth, it has a TVL of around US$1.5 billion to date, ranking it 40th among public chains, and this rate is far less than that of the up-and-coming public chains that are just starting.

 Footprint Analytics - Stellar TVL 
Footprint Analytics – Stellar TVL 

There are more than 100 projects and partners building within Stellar’s ecosystem.

 Footprint Analytics -Protocols TVL in Stellar
Footprint Analytics -Protocols TVL in Stellar

Reasons for Stellar’s Slow Growth

Poor Ecosystem Incentives

At the time of Stellar’s creation, an inflation mechanism was set up to prevent a reduction in the circulation of XLM.

Each year the inflation scheme generates tokens equal to 1% of Stellar’s total supply and accounts for more than 0.05% of Stellar’s total share receiving additional XLM coins.

The purpose of the inflatable mechanism is to incentivize. However, analysis by Coinmetrics shows that 98% of the XLM incremental coins went to the SDF (Stellar Development Foundation) and did not benefit the Stellar project.

One reason for this is that the foundation has been involved since the early days and therefore can participate in the annual distribution of newly generated tokens.

The second reason is that most Stellar participants joined during the 2017 burst and are speculative users with little involvement in the ecosystem.

 XLM inflation CoinMetrics
XLM inflation CoinMetrics

The Omission of SDF

The foundation holds a large number of tokens due to inflationary mechanisms. However, the foundation has failed to use these tokens to help the project function better. Crypto Slate analysts stated in 2019 that the foundation has only consumed $40,000 for community projects. Having a large amount of money but not using it well maps out the inaction of the foundation.

In 2019, the Stellar Development Foundation initially mitigated the token mismatch by ending its inflation plan and destroying more than 50% of its tokens. However, XLM still needs to expand its usage scenario.

The Road Ahead for Stellar

Although Stellar ended up lagging since its launch, it is set to make a comeback from 2021.

With the explosion of DeFi projects, multi-currency, cross-chain transfers are a current blockchain pain point, and Stellar offers one of the solutions that define a new standard for global payments.

Stellar has gained market recognition through expanded payment companies, national banks, financial institutions, and more, gaining recognition from multiple parties and several strong partners as a global solution for cross-border payments.

EVM Compatibility

The incompatibility of Stellar contracts with EVM means that developers cannot quickly deploy projects on Ethereum to Stellar in February 2021.

FlareNetworks has announced the integration of Stellar Lumens (XLM) with its smart contract platform, thus enabling compatibility with the Ethereum blockchain. If successfully landed, Stellar will be even more scalable.

Summary

Stellar’s recent moves show that it continues to interface with the financial community and bridge the gap between traditional and on-chain payments.

We can keep an eye on Stellar and look forward to its continued development in solving global payments challenges.

This report was brought to you by Footprint Analytics.

What is Footprint

Footprint Analytics is an all-in-one analysis platform to visualize blockchain data and discover insights. It cleans and integrates on-chain data so users of any experience level can quickly start researching tokens, projects and protocols. With over a thousand dashboard templates plus a drag-and-drop interface, anyone can build their own customized charts in minutes. Uncover blockchain data and invest smarter with Footprint.

 Everdome

CryptoSlate Newsletter

Featuring a summary of the most important daily stories in the world of crypto, DeFi, NFTs and more.

Get an edge on the cryptoasset market

Access more crypto insights and context in every article as a paid member of CryptoSlate Edge.

On-chain analysis

Price snapshots

More context

Join now for $19/month Explore all benefits


Read More https://bitcofun.com/footprint-analytics-stellar-aims-for-rebound-in-2022/?feed_id=9223&_unique_id=6221dd21600d7

Tuesday, March 1, 2022

Footprint Analytics: Over 600 Projects Got REKT in 2021, $2.2B Lost | Annual Report 2021

Cryptocurrencies

Analysis

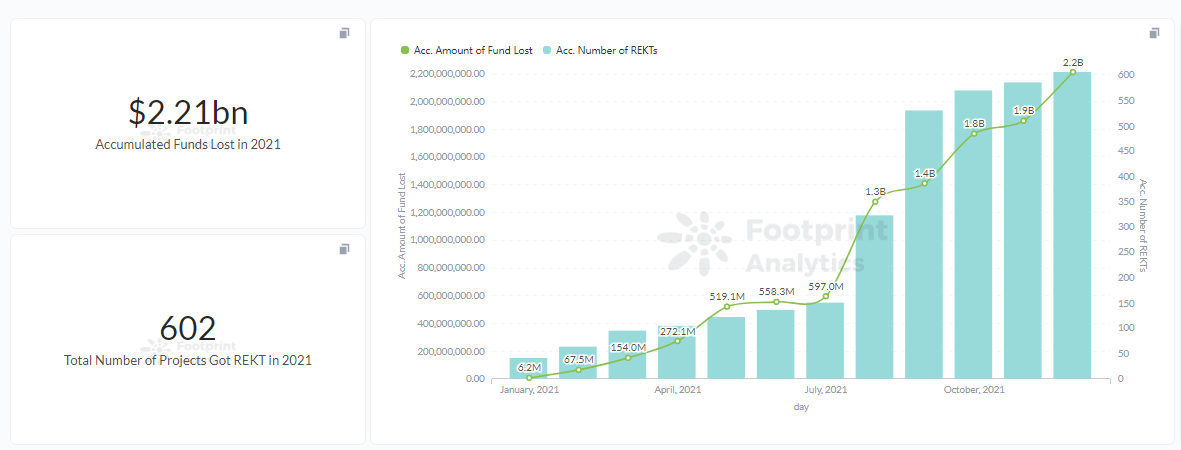
Over 600 REKT projects in 2021, mostly from Exit scams & Honeypots, funds lost totaling to $2.2 billion.

cryptocurrencies Footprint Analytics: Over 600 Projects Got REKT in 2021, $2.2B Lost  | Annual Report 2021

cryptocurrencies Symbiosis

In the crypto world, there are 4 main ways you can get REKT (“experience significant financial loss due to shady malfeasance”—in crypto terms).

  • An exit scam is a project that simply vanishes with investors’ money during or after going live.
  • A honeypot lures investors into vulnerable contracts that contain hidden traps locking their assets
  • An exploit attack takes advantage of vulnerabilities in applications, networks, and operating systems.
  • A flash loan attack involves taking out a flash loan (a form of uncollateralized lending) from a lending protocol and manipulating the market in your favor.
cryptocurrencies Footprint Analytics:  REKT Overview in 2021
Footprint Analytics:  REKT Overview in 2021

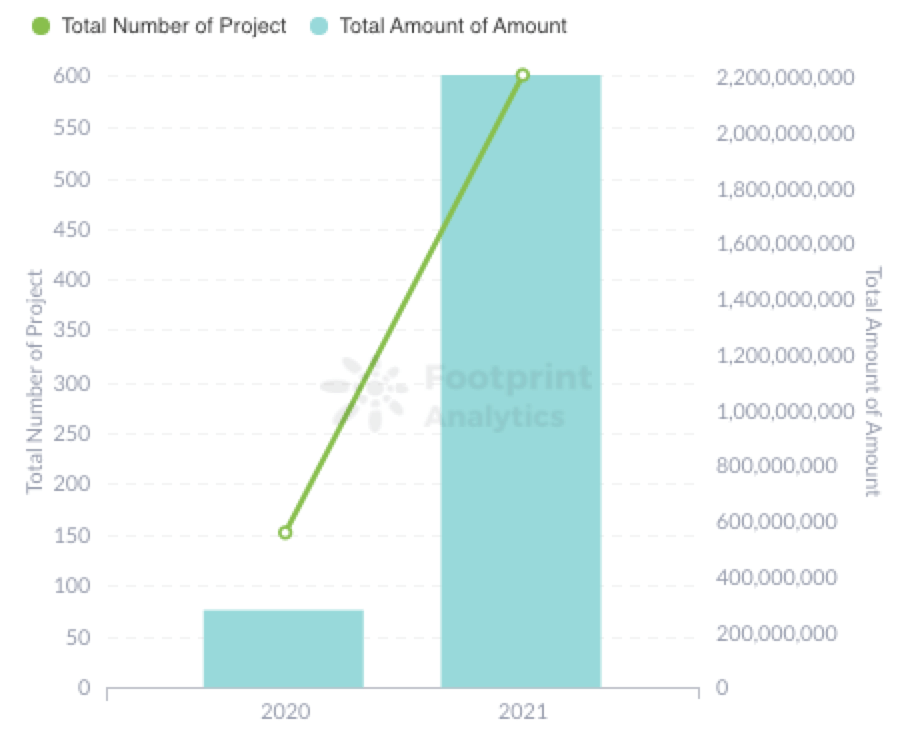
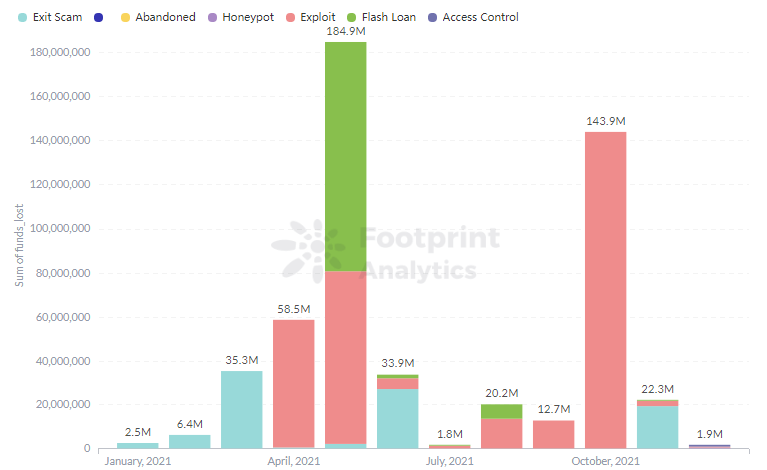
According to Footprint Analytics, over 600 projects got REKT in 2021. One third of these were recorded to encounter fund loss, accumulating to the amount of $2.2 billion.

Compared to 2020, approximately 450 more projects were hacked, causing 10x more funds being lost.  Looking at the data, here are the findings.

cryptocurrencies Footprint Analytics: Yearly REKT Number & Fund
Footprint Analytics: Yearly REKT Number & Fund

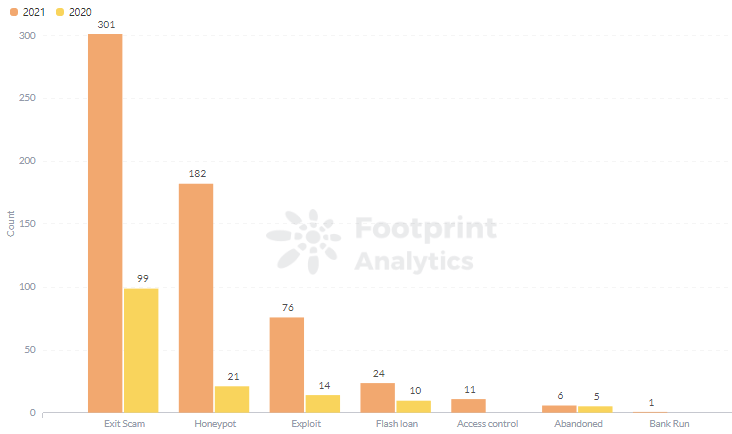
Cryptocurrencies Finding 1: Exit Scams and Honeypots Were the Most Popular Crypto Scams

cryptocurrencies Footprint Analytics: Number of REKT by Type, Yearly Comparison
Footprint Analytics: Number of REKT by Type, Yearly Comparison

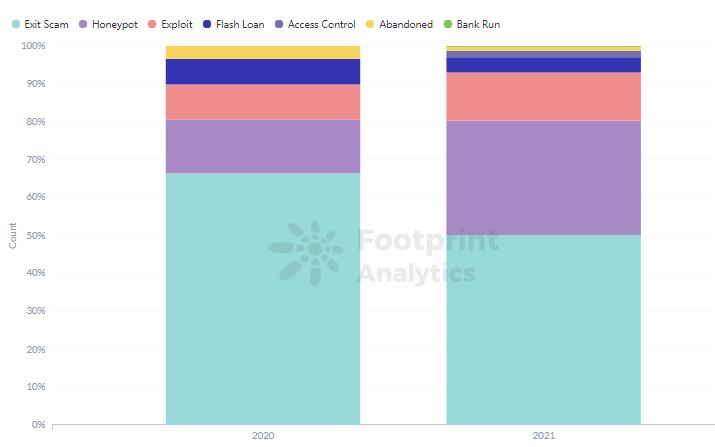
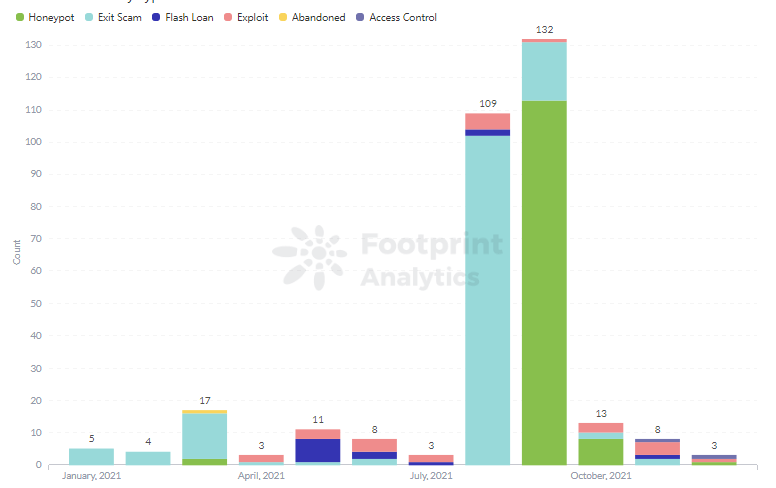
Exit scams and honeypots accounted for 50% and 30% of all scams in 2021, respectively. Compared to the previous year, the percentage of honeypots has increased by 16%.

cryptocurrencies Footprint Analytics: Distribution of REKT by Type, Yearly Comparison
Footprint Analytics: Distribution of REKT by Type, Yearly Comparison
cryptocurrencies Footprint Analysis: Monthly Exit Scams by Chain
Footprint Analysis: Monthly Exit Scams by Chain

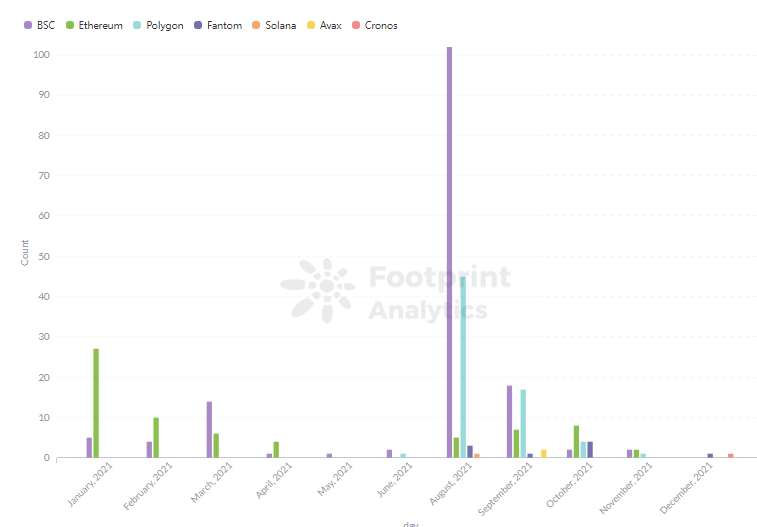
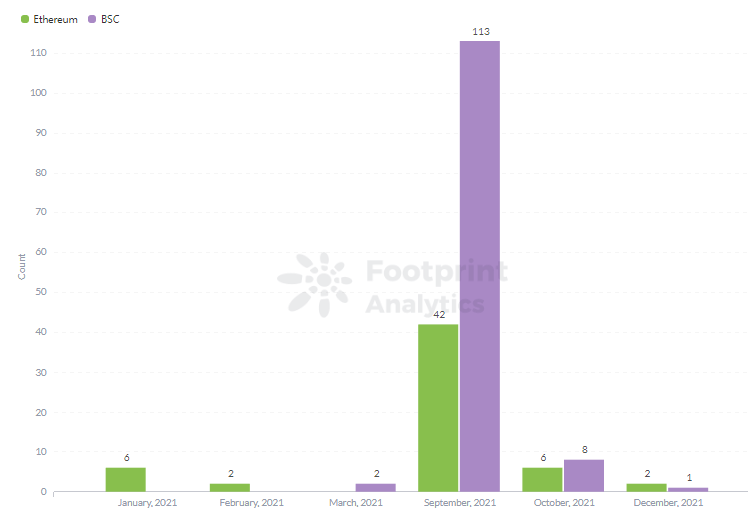
Most exit scams happened between August and September, mostly on BSC and Polygon.

cryptocurrencies Footprint Analysis: Monthly Honeypots by Chain
Footprint Analysis: Monthly Honeypots by Chain

As for honeypots, September was the most severe month, especially on BSC, accounting for nearly 70% of this kind of scam.

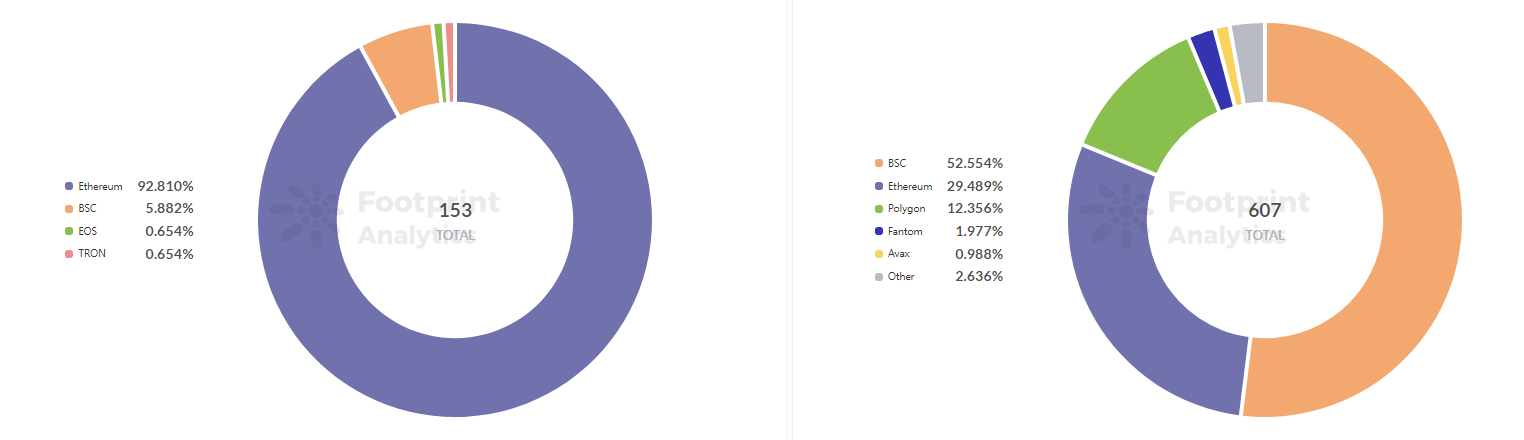
Cryptocurrencies Finding 2: BSC made up 53% of REKT Attacks

Compared to the previous year, the number of attacks on BSC increased from 9 to 319. Polygon, a new blockchain in 2021, also got 12% of the brunt.

cryptocurrencies Footprint Analytics: Number of REKT by Chain in 2020 and 2021
Footprint Analytics: Number of REKT by Chain in 2020 and 2021

Exit scams and honeypots were the two major types of attacks on BSC. It is worth noting that the former had a huge explosion in August, likely due to the fast growth of project numbers on BSC and the accumulated funds on these projects. This will be explained later in the article.

cryptocurrencies Footprint Analytics: Number of REKT by Type of BSC
Footprint Analytics: Number of REKT by Type of BSC

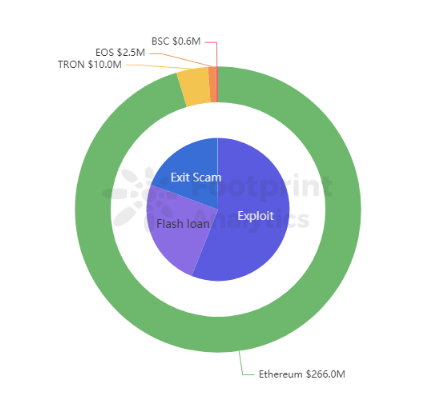
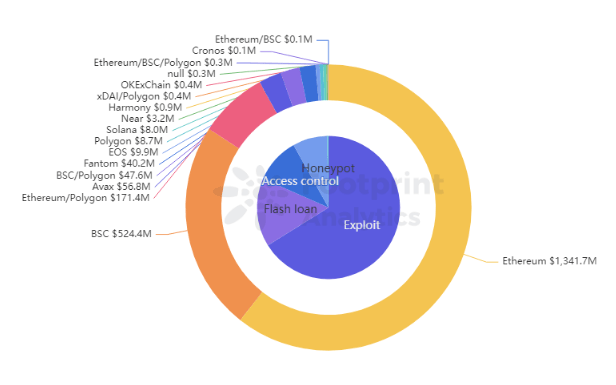
Cryptocurrencies Finding 3: 67% of All Funds Lost Happened on Ethereum

Although most attacks happened on BSC, more funds were lost on Ethereum, mainly through exploit and flash loan attacks. The amount of money lost grew by 500% compared to 2020.

cryptocurrencies Footprint Analytics: Fund Lost Amount by Chain & Type in 2020
Footprint Analytics: Fund Lost Amount by Chain & Type in 2020
cryptocurrencies Footprint Analytics: Fund Lost Amount by Chain & Type in 2021
Footprint Analytics: Fund Lost Amount by Chain & Type in 2021

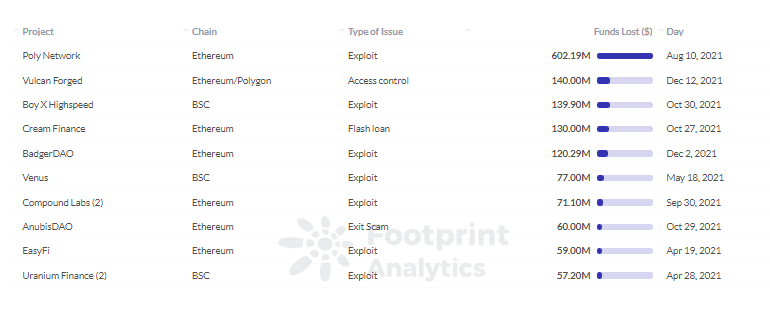
Here is the list of attacks by funds lost:

From the above attacks, 50% of them have lost $10K to $1M funds, another 35% was between $1M and $50M.

Poly Network was the biggest victim of all, losing $602 million caused by an exploit in August. The biggest flash loan victim was Cream Finance, where $130 million was lost.

cryptocurrencies Footprint Analytics: Attacks Causing Lost More Than 50M
Footprint Analytics: Attacks Causing Lost More Than 50M

Cryptocurrencies Why Did Scams and Attacks Thrive in 2021?

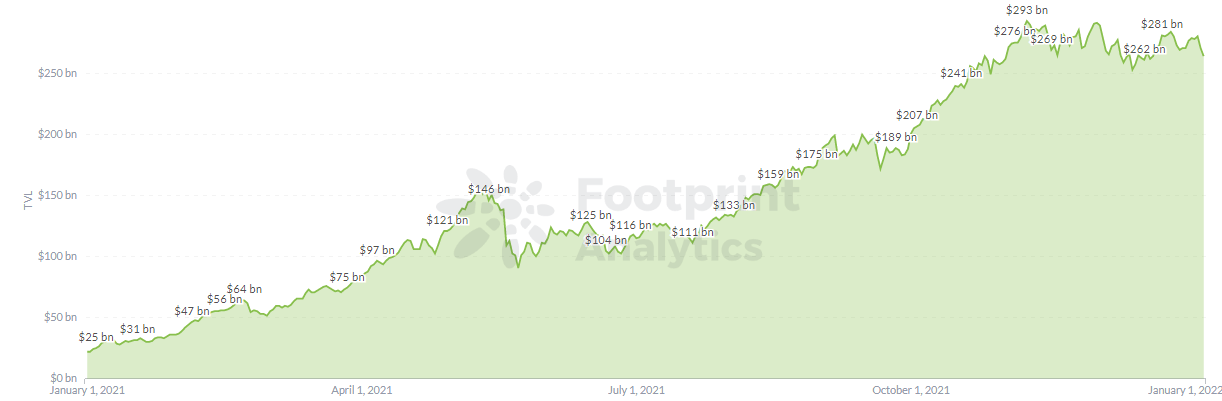
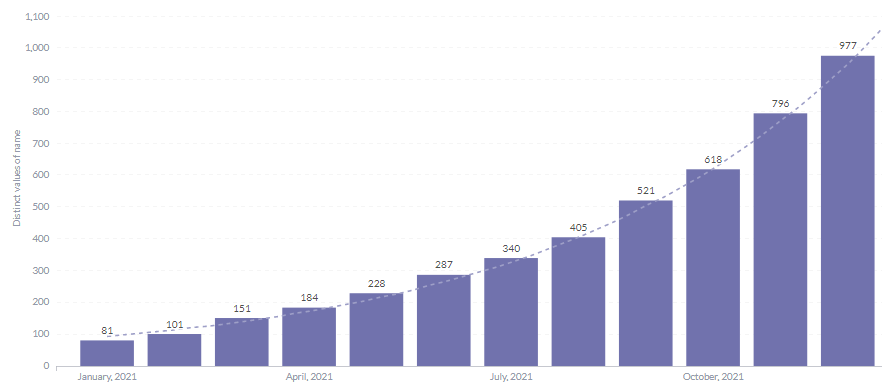
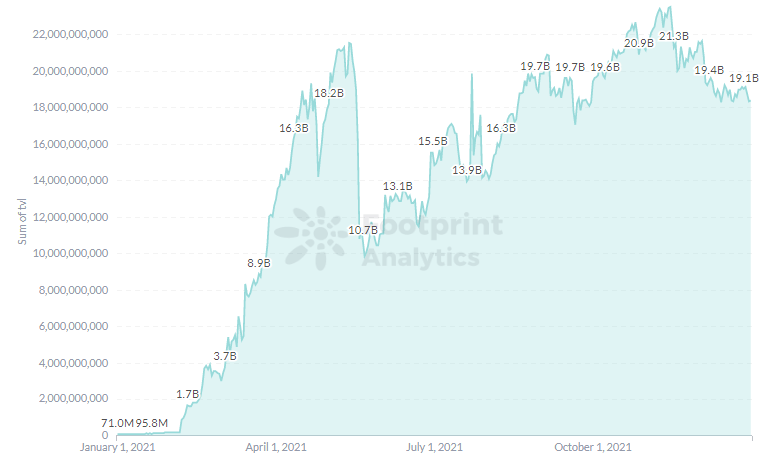
One reason for the increasing number of attacks comes from the rapid growth of blockchain DApps. The current number of DeFi protocols reached 977 across 86 chains.

cryptocurrencies Footprint Analytics: TVL of All DeFi Protocols
Footprint Analytics: TVL of All DeFi Protocols
cryptocurrencies Footprint Analytics: Number of DeFi Protocols
Footprint Analytics: Number of DeFi Protocols

Another reason is that more and more hackers have noticed the increasing TVL of crypto and blockchain projects.

Cryptocurrencies Why Did BSC See the Most Attacks?

Most projects on BSC, a Layer 2 chain to Ethereum, have been built by simply forking Ethereum protocols. Many of these have little innovation, long-term development plans or an understanding of the basic logic behind the code.

These factors make the projects vulnerable to hackers, who can easily discover loopholes in a protocol. Once the TVL accumulated on similar projects grows large enough, it is the timing for them to conduct attacks.

Furthermore, low gas fees on BSC make conducting attacks much more feasible.

cryptocurrencies Footprint Analytics: TVL of BSC in 2021
Footprint Analytics: TVL of BSC in 2021
cryptocurrencies Footprint Analytics: TVL of BSC in 2021
Footprint Analytics: TVL of BSC in 2021

Cryptocurrencies Thoughts on Not Getting REKT

In 2021, more and more people entered the crypto world.

Some bought a few tokens, others invested in DeFi projects, and others still bought NFTs, or even moved in next door to celebrities in the metaverse. Widespread adoption of this technology entails more hacking, scams and attacks.

DeFi developers should therefore focus more on safety awareness, such as conducting logic checks on code to rule out possible vulnerabilities and seeking help from professional auditing teams.

Investors will need to perform more due diligence as the thriving blockchain industry attracts more bad actors. If you’re just getting started, watch out for:

  • Projects with crazy incentives.
  • Suspicious links in group chats, direct messages from strangers, or search engine results. Never send out your private key or seed—this is the most important rule to protect yourself from phishing attacks.
  • Airdrops that claim to give you astronomical returns for your tokens.

The only way to not get REKT is to stay calm and think clearly.

Cryptocurrencies Benefits for CryptoSlate Reader

From 11 to 25 January 2022, click this hyperlink on CryptoSlate to get a free 7-day trial of Footprint Analytics! New users only!

Date and Author: Jan13th 2022, [email protected]

Data Source:  REKT Overview in 2021

This article is part of our Year in Review series.

Cryptocurrencies What is Footprint Analytics?

Footprint Analytics is an all-in-one analysis platform to visualize blockchain data and discover insights. It cleans and integrates on-chain data so users of any experience level can quickly start researching tokens, projects and protocols. With over a thousand dashboard templates plus a drag-and-drop interface, anyone can build their own customized charts in minutes. Uncover blockchain data and invest smarter with Footprint.

cryptocurrencies Everdome

Cryptocurrencies CryptoSlate Newsletter

Featuring a summary of the most important daily stories in the world of crypto, DeFi, NFTs and more.

Cryptocurrencies Get an edge on the cryptoasset market

Access more crypto insights and context in every article as a paid member of CryptoSlate Edge.

On-chain analysis

Price snapshots

More context

Join now for $19/month Explore all benefits


Read More https://bitcofun.com/footprint-analytics-over-600-projects-got-rekt-in-2021-2-2b-lost-annual-report-2021/?feed_id=8898&_unique_id=621f0ed6d7435

Wednesday, February 16, 2022

Footprint Analytics: Will the London Upgrade Deflate ETH? | Annual Report 2021

Analysis

In 2021, the London upgrade turned on ETH’s burning mechanism.

 Footprint Analytics: Will the London Upgrade Deflate ETH? | Annual Report 2021

 Symbiosis

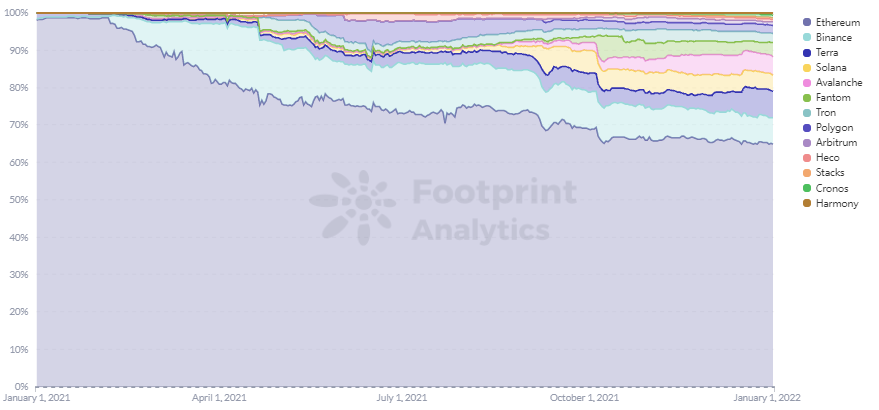
Ethereum remained the top blockchain in 2021 by TVL (total value locked), but its market share continued to erode, dropping from nearly 100% at the beginning of the year to 65%.

Its main problem is the PoW (Proof of Work Mechanism), which causes transactions to be slow and expensive.

Ethereum devs have realized new L1s are providing faster, more convenient networks and pushed toward the Ethereum 2.0 upgrade with four hard forks in 2021 in preparation for the replacement of PoW with PoS (Proof of Stake).

These forks were:

  • April: Berlin upgrade
  • August: London upgrade
  • October: Beacon Chain Altair upgrade
  • December: Arrow Glacier upgrade

Of the four, the London upgrade has received the most attention, mainly because it affects everyone—users, holders, miners, and developers.

Footprint Analytics – Market Share of TVL by Chain

Footprint Analytics analyzed this upgrade in Who benefits from EIP-1559? in August. Besides smoothing out gas fee changes by allowing variable block sizes, splitting the gas fee into Base Fee and Priority Fee, and burning out the base fee, the London Upgrade will likely enable ETH to continue increasing in value by making it deflationary, among other benefits.

Changes From the London Upgrade

The main effects of this upgrade are:

  • More stable and predictable gas fees: With base fee price based on previous block usage, it can vary between blocks by up to 12.5%, which makes it easier for users to accurately predict the amount of gas they will spend. Note that this doesn’t necessarily mean lower gas fees.
  • Miners will lose revenue: After the upgrade, miners will no longer reap the entire gas fee as before, but only part of the priority fee. Future income will also rely mainly on block rewards.
  • The ecosystem will start burning ETH: Ethereum has launched a burn mechanism that makes the inflation rapidly slowing down. This change will likely tie the value of ETH to the value of the use of the network.

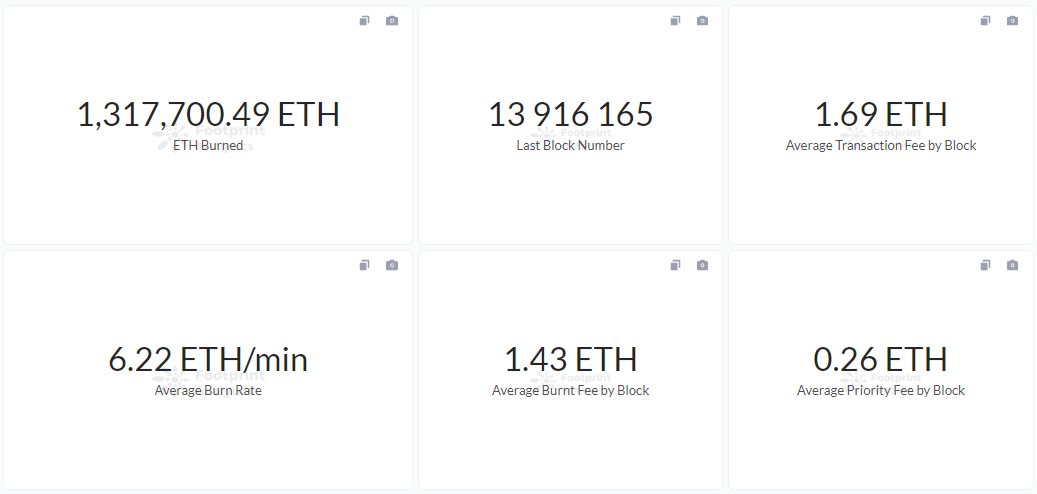
As of Dec. 31, five months after the burn mechanism was launched, 1,317,700 ETH have been burned, with about 6.22 ETH being burned every minute, and 1.43 ETH per block.

Footprint Analytics – ETH Burnt

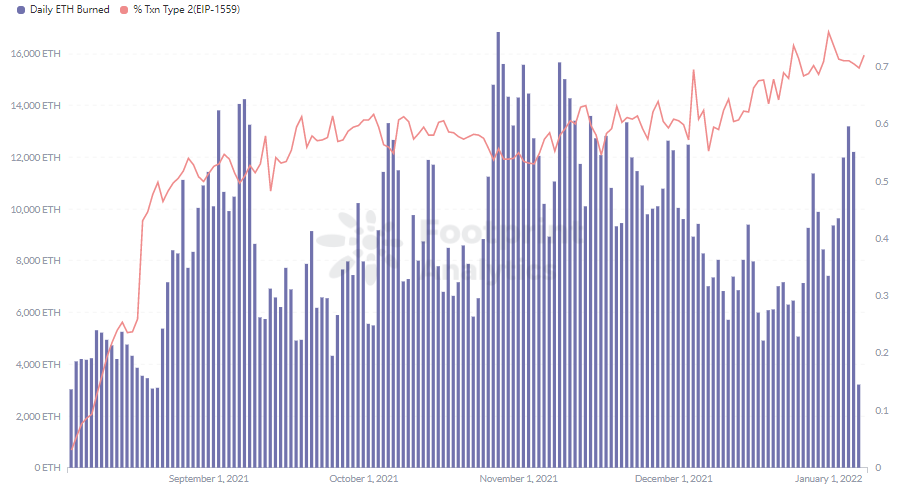
The number of users who choose EIP-1559 as their transaction type is also gradually increasing, from 50% at the beginning to 70%, and on average about 10,000 ETH will be burned every day.

Footprint Analytics – Daily ETH Burnt

While the London upgrade does not overhaul the network experience and cut down fees, it sets the stage for Ethereum 2.0. By delaying the difficulty bomb—a mechanism to force PoW to stop producing blocks—it ensures miners can still earn revenue without going “on strike” under the PoW mechanism until the Beacon chain is ready to implement PoS.

How Does the London Upgrade Make ETH Deflationary?

The London upgrade was the first step to make ETH deflationary, and the Ethereum 2.0 and Layer 2 expansion will continue this effort. The Ethereum mainnet will complete the merger with the Beacon chain in 2022. After the upgrade, PoW will turn into the PoS mechanism, while the block structure will shift from single chain to multi-chain fragmentation.

The PoS mechanism allows for better energy efficiency and increased capacity. TPS on Ethereum 2.0 could reach 2,000 to 3,000, and eventually 100,000 TPS, solving the current congestion problem.

The PoW mechanism will be removed, meaning that mining—as done up to that point—will become a thing of the past and new incremental issues will only be issued through the PoS mechanism of 400,000 to 700,000 per year. After the London upgrade, at the current burning rate of about 10,000 ETH per day, about 3.65 million ETH will be burned each year, far more than the number of incremental issues.

Summary

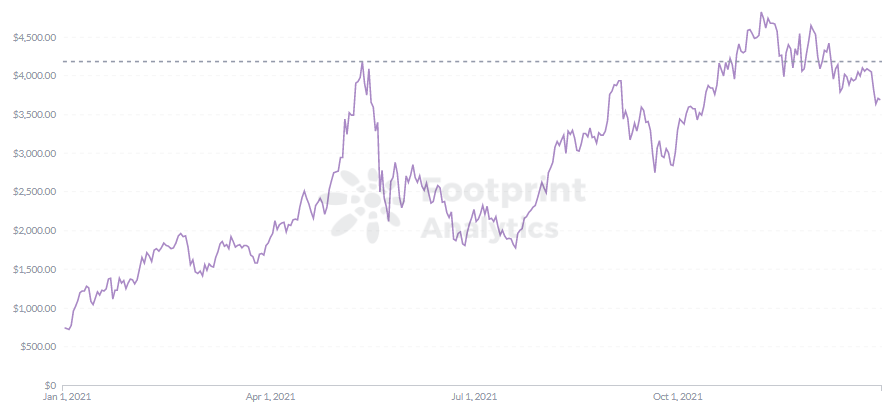
In 2021, we saw the price of ETH rise from $738 at the beginning of the year to $4,182 in May. After a big drop in the price of the cryptocurrency, the price of ETH gradually heated up, reaching a high of $4,826 for the year in November. While this was boosted by the growth of the projects during the summer of DeFi, the reduced rate of inflation after the London upgrade also played a role.

Footprint Analytics – ETH Price

After the launch of Ethereum 2.0 in December 2020, the mining rewards were gradually reduced. Tim Beiko, the Ethereum developer, expects the merger of Ethereum 1.0 and 2.0 in April or May 2022, after which Ethereum 1.0 will probably fade away and eventually become abandoned. With the arrival of the PoS mechanism, the PoW mechanism of Ethereum 1.0 will become history and the deflation of ETH will come soon. For those who are bullish on Ethereum, 2022 may be an “ETH Summer” to look forward to.

Benefits for CryptoSlate Readers

From 11 to 25 January 2022, click this hyperlink on CryptoSlate to get a free 7-day trial of Footprint Analytics! New users only!

Date & Author: Jan 12th, 2022, [email protected]

Data Source: Footprint Analytics Ethereum Dashboard

This article is part of our Year in Review series.

What is Footprint Analytics

Footprint Analytics is an all-in-one analysis platform to visualize blockchain data and discover insights. It cleans and integrates on-chain data so users of any experience level can quickly start researching tokens, projects and protocols. With over a thousand dashboard templates plus a drag-and-drop interface, anyone can build their own customized charts in minutes. Uncover blockchain data and invest smarter with Footprint.

 Everdome

CryptoSlate Newsletter

Featuring a summary of the most important daily stories in the world of crypto, DeFi, NFTs and more.

Get an edge on the cryptoasset market

Access more crypto insights and context in every article as a paid member of CryptoSlate Edge.

On-chain analysis

Price snapshots

More context

Join now for $19/month Explore all benefits


Read More https://bitcofun.com/footprint-analytics-will-the-london-upgrade-deflate-eth-annual-report-2021/?feed_id=6857&_unique_id=620d85d422953

Leading 7 Decentralized Derivatives Trading Platforms

Decentralized derivatives are a brand-new method for traders to trade crypto possessions without straight holding them. Read on to disc...